By AppsHive Team
High Alert!
A mobile app is something that a business/startup needs regardless of any industry niche!
The world agrees with the above-mentioned line. Though, the question is why you must be aware of the app store data before deploying your business app.
Let’s start with initials!
Every day, trillions of data are generated via different apps on the App Store & Play Store. And, the cutthroat competition among the apps is a new normal in today’s time.
That’s where app store data comes into the picture! Remember, data is a key to building and successfully launching your mobile app.
Adding more to it, you get an idea of how to mould your app in a way that gains the users’ attention in every form.
This blog talks about everything that you need to know about iOS and Android app stores.
Let's start with Android and iOS app store statistics.
App Store Statistics - A Numerical Insights Into App Market
The fact is across the globe, Apple and Google cover more than 95% of the app store market. They initiated with a few installed apps and later came up with their own app stores respectively. As a result, it enabled third-party app owners to publish their mobile apps on app stores.
Here are a few stats on app store data, and where the actual numbers have reached since the first launch.
- The total number of mobile app downloads in 2022 is 255bn.
- Users spend more than 90% of their time on mobile screens while using Apps.
- On average, a user has approximately 80 mobile apps on their smartphone.
- Mobile app gaming has seen the highest number of rise in users.
- A whole 100,000 apps are released monthly on Google Play Store and Apple App Store.
- The total revenue generated by App Market last year is US$430.90bn with a 7.7% CAGR.
- Also, mobile apps are expected to generate over $935 billion in revenue in 2023.
- According to the fact, millennials open an app more than 50 times a day.
That's all about some of the combined stats of both app stores. Now, let's move towards respective app store data for Google and Apple app stores.
iOS App Store - A Comprehensive Data Collected for Your App Business Needs
Here is an overview of some of the key statistics on App Store Data.
- On average the monthly app published on Apple App Store is 34.6k.
- A total of 5-6k apps are published weekly on the iOS Apple App Store.
- Coming to the publishers - there are 737.01k app publishers on the Apple App Store.
- Approximately, 1.96 million mobile apps are on the iOS app store. (the graph below shows some more numbers on the apps available in the app store)
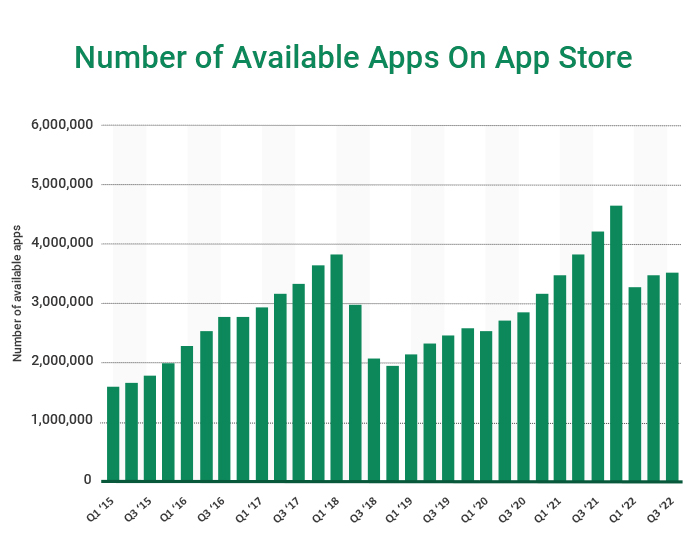
Annual Apps on the App Store Year By the Year Year Apps (mm) 2009 0.068 2010 0.144 2011 0.271 2012 0.437 2013 0.691 2014 0.942 2015 1.202 2016 1.603 2017 1.583 2018 1.523 2019 1.453 2020 1.420 2021 1.415 2022 1.96
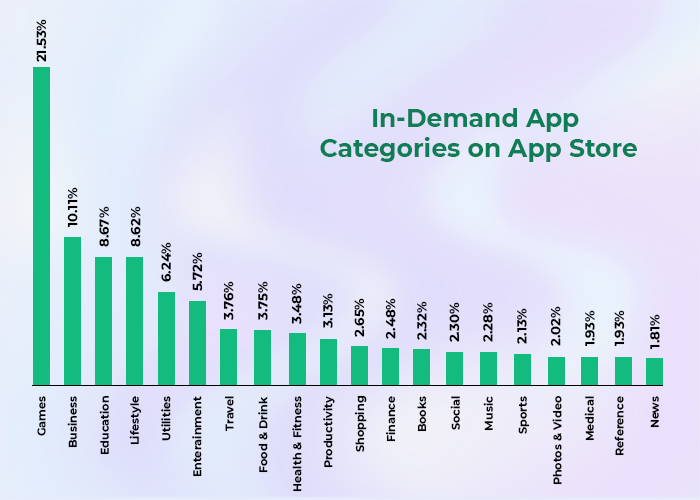
The Most Popular Categories on App Store
As we already mentioned, the number of mobile apps present in the iPhone app store. Now it's time to keenly divide the apps based on their categories. The below-given graph shows the popular app categories in the app store in descending order.
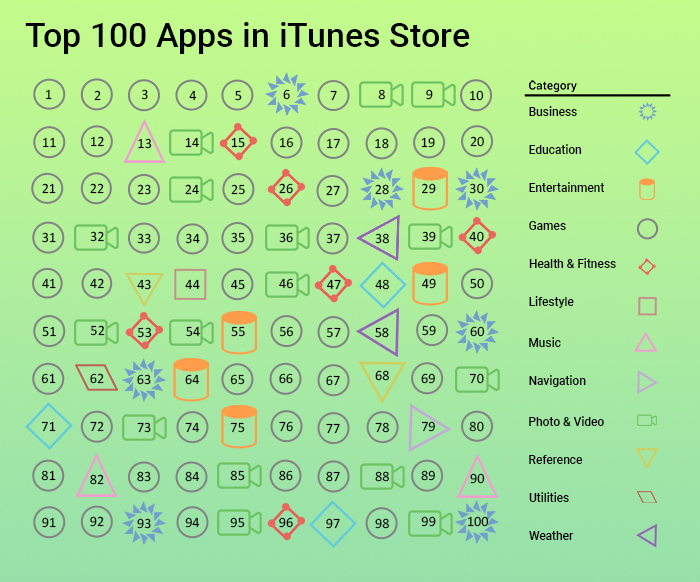
Here is one more image that talks about the top 100 apps listed in the iOS App Store based on their categories.
Apps Vs Games
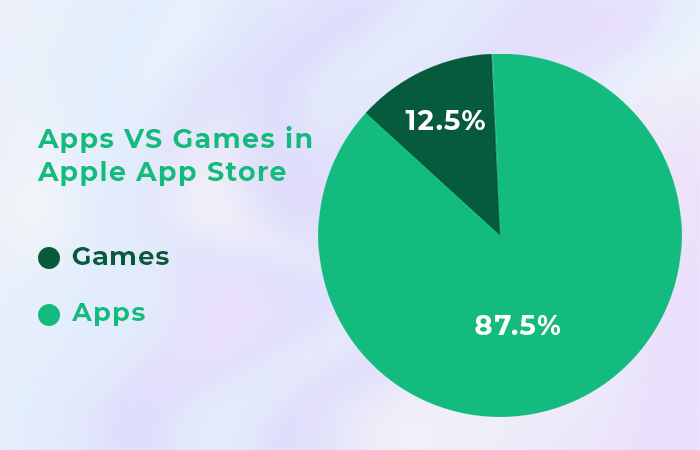
The biggest competition that goes among the app store categories is Apps vs Games. This is because many times we’ve witnessed that app store games cover the highest portion among all app categories.
We can say that on the iOS Apple App Store, there are approximately 216,549 games available. The below-given image shows the percentage covered by app store games.
App Rating Distribution on Apple App Store
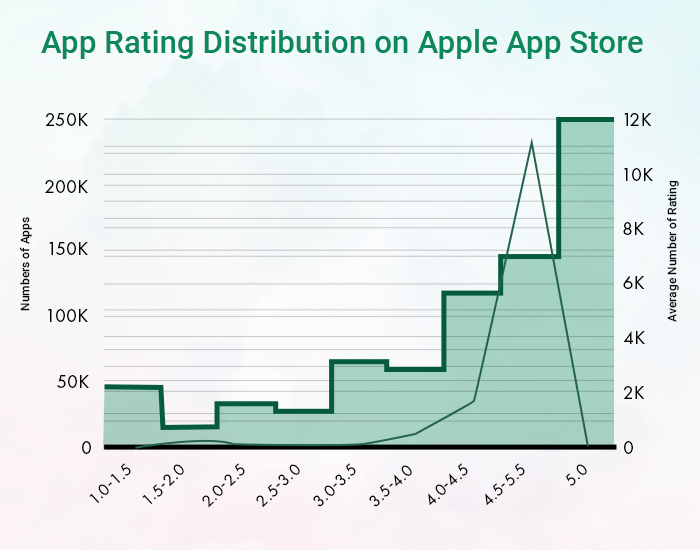
What is the first thing that comes to your mind when you think of downloading an application? The ratings of the app? Ofcourse, app rating plays an important role in app store data.
According to one of the reports, currently, 757,854 (44%) apps have been rated by users across the globe, whereas 978,767 (56%) apps have not yet been rated. The graph makes your thoughts more clear on it.
Apps in the Apple App Store brought in nearly double the revenue of those in the Google Play Store.
Google Play Store - Important Stack of Data You Must Know
Before going to the Google app store data, let’s first go through some brief stats on Google Apps and Play Store.
- On average, approximately 70,000 apps are released monthly on Google Play Store.
- Only 52% of Android smartphone users have game apps installed on their smartphones.
- 1.14M app publishers have published apps on Google Play Store.
- Users are projected to spend more than 60 Billion USD by the end of the year 2023.
- A total of 3.79M apps are available on the Android app store.
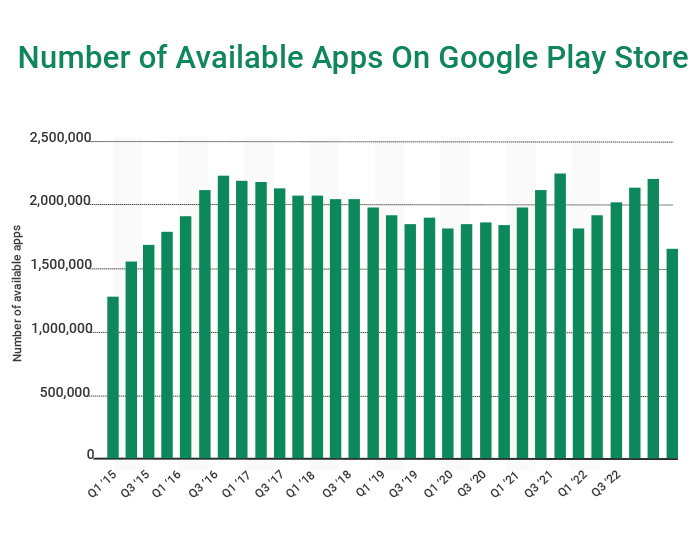
| Year | Apps (mm) |
| 2010 | 0.069 |
| 2011 | 0.250 |
| 2012 | 0.519 |
| 2013 | 0.793 |
| 2014 | 1.046 |
| 2015 | 1.343 |
| 2016 | 2.054 |
| 2017 | 2.765 |
| 2018 | 2.122 |
| 2019 | 2.324 |
| 2020 | 2.431 |
| 2021 | 2.337 |
| 2022 | 3.794 |
The Most Popular Categories on Google Play Store
Okay, this is one of the most interesting sections of any app store data. We have shown you the most popular app categories in two ways. The first is via a graph and the second is via a numerical table.
Have a look at both presentations to get the best idea of app categories and its percentage.
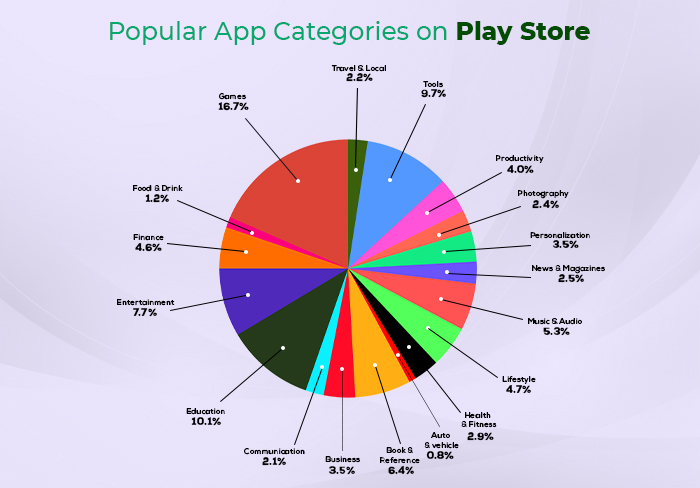
Now, here is the number presentation with some extra details on Android app's popular categories.
| Category | Number of Apps | Apps with above 50K downloads | Paid apps | Average price |
| Education | 263,682 | 19603 (7%) | 13551 (5%) | $ 6.47 |
| Business | 171,540 | 6242 (4%) | 1679 (1%) | $ 13.78 |
| Music & Audio | 161,682 | 11425 (7%) | 2882 (2%) | $ 5.46 |
| Tools | 153,516 | 21892 (14%) | 7770 (5%) | $ 7.74 |
| Entertainment | 142,491 | 20102 (14%) | 3978 (3%) | $ 6.12 |
| Lifestyle | 122,461 | 11026 (9%) | 2528 (2%) | $ 7.31 |
| Books & References | 120,305 | 11026 (9%) | 8010 (7%) | $ 5.97 |
| Food & Drinks | 113,451 | 3189 (3%) | 660 (1%) | $ 13.67 |
| Shopping | 107,987 | 7125 (7%) | 283 (0%) | $ 13.80 |
| Personalization | 104,150 | 13195 (13%) | 16367 (16%) | $ 1.90 |
| Productivity | 100,813 | 7429 (7%) | 3794 (4%) | $ 9.66 |
| Health & Fitness | 91350 | 6319 (7%) | 2480 (3%) | $ 6.81 |
| Finance | 83364 | 11836 (14%) | 1544 (2%) | $ 8.84 |
| Travel & Local | 70204 | 4847 (7%) | 2490 (4%) | $ 3.76 |
| Casual | 61568 | 9641 (16%) | 1672 (3%) | $ 8.32 |
| Puzzle | 60144 | 8039 (13%) | 3020 (5%) | $ 6.35 |
| Arcade | 59022 | 5462 (9%) | 1991 (3%) | $ 8.34 |
| Communication | 58212 | 5133 (9%) | 1141 (2%) | $ 7.45 |
| Social | 50143 | 5003 (10%) | 481 (1%) | $ 8.67 |
| Sports | 47809 | 3641 (8%) | 2412 (5%) | $ 19.67 |
| News & Magazines | 44775 | 3965 (9%) | 225 (1%) | $ 4.50 |
| Medical | 41326 | 2731 (7%) | 2446 (6%) | $ 11.52 |
| Photography | 35597 | 7395 (21%) | 1063 (3%) | $ 6.57 |
| Maps & Navigation | 33337 | 3400 (10%) | 1479 (4%) | $ 5.90 |
| Action | 32386 | 6738 (21%) | 1261 (4%) | $ 4.27 |
| Simulation | 28272 | 10456 (37%) | 1060 (4%) | $ 5.08 |
| Auto & Vehicles | 27444 | 1994 (7%) | 674 (2%) | $ 8.47 |
| Adventure | 25041 | 4845 (19%) | 1762 (7%) | $ 5.70 |
| Educational | 24745 | 3682 (15%) | 2504 (10%) | $ 3.38 |
| Art & Design | 20209 | 2064 (10%) | 737 (4%) | $ 4.74 |
| Beauty | 18857 | 866 (5%) | 81 (0%) | $ 6.61 |
| Events | 18853 | 320 (2%) | 68 (0%) | $ 12.59 |
| House & Home | 18738 | 984 (5%) | 195 (1%) | $ 5.33 |
| Trivia | 14967 | 1756 (12%) | 365 (2%) | $ 6.10 |
| Video Player & Editors | 14118 | 3620 (26%) | 581 (4%) | $ 7.92 |
| Role Playing | 13734 | 5406 (39%) | 995 (7%) | $ 5.08 |
| Board | 11815 | 2446 (21%) | 720 (6%) | $ 4.63 |
| Strategy | 11801 | 3299 (28%) | 814 (7%) | $ 6.96 |
| Racing | 11770 | 3452 (29%) | 333 (3%) | $ 6.60 |
| Word | 11757 | 1915 (16%) | 393 (3%) | $ 5.25 |
| Card | 9785 | 2830 (29%) | 532 (5%) | $ 3.54 |
| Sports Games | 8613 | 2406 (28%) | 418 (5%) | $ 4.78 |
| Weathers | 8581 | 2628 (31%) | 336 (4%) | $ 6.01 |
| Dating | 7116 | 1218 (17%) | 60 (1%) | $ 13.27 |
| Casino | 6751 | 1861 (28%) | 341 (5%) | $ 8.62 |
| Music | 6144 | 1339 (22%) | 194 (3%) | $ 5.85 |
| Libraries & Demo | 5686 | 394 (7%) | 134 (2%) | $ 10.07 |
| Parenting | 5022 | 699 (14%) | 207 (4%) | $ 6.09 |
| Comics | 2944 | 699 (24%) | 184 (6%) | $ 4.42 |
Note - You might see a percentage difference in some categories, that is because the above table shows a distribution of percentage between free and paid apps)
Apps Vs Games
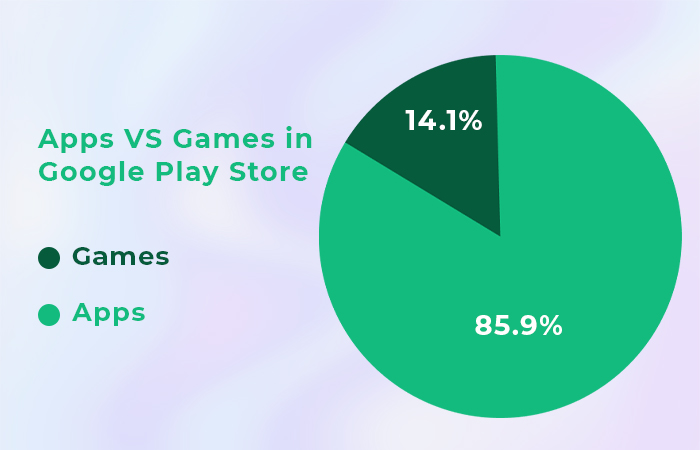
Just like Apple Store, Android apps also cover a higher percentage of the portion of games. In fact, the Google store has a bigger portion of games in comparison to the iOS store.
As mentioned before, a total of 3,788,024 Android apps are available - And out of this 533,285 are gaming apps. Know the exact percentage via the graph given below.
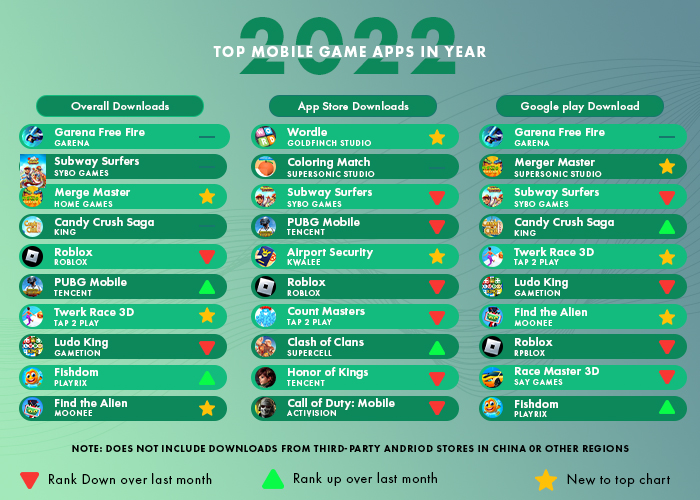
Also, here is one more presentation that shows the most popular game apps in respective app stores.
App Rating Distribution on Google Play Store
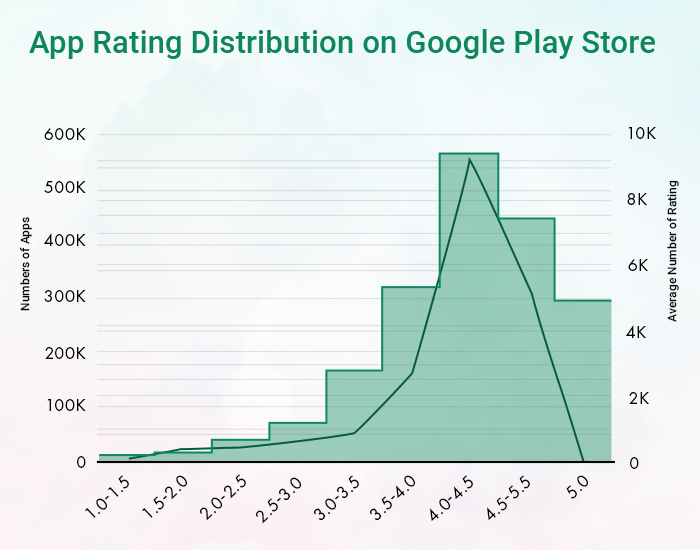
In comparison to the App Store, it is observed that Google Play has average ratings.
For instance, 1,934,146 (51%) Android apps have been rated on the play store whereas 1,853,878 (49%) are still unrated. The graph given below shall give you a better understanding.
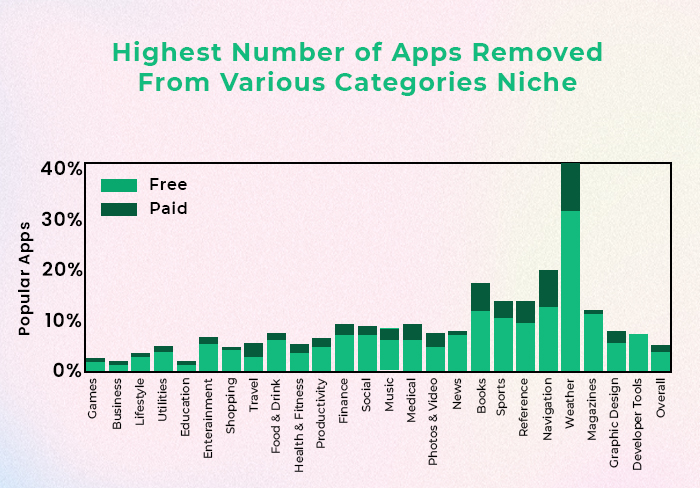
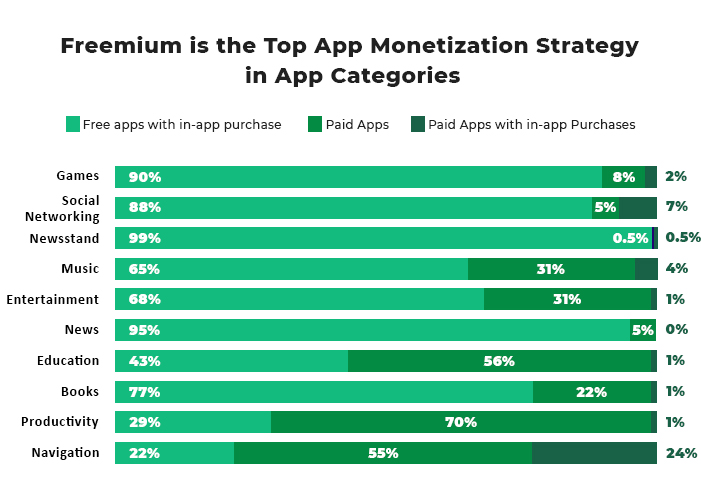
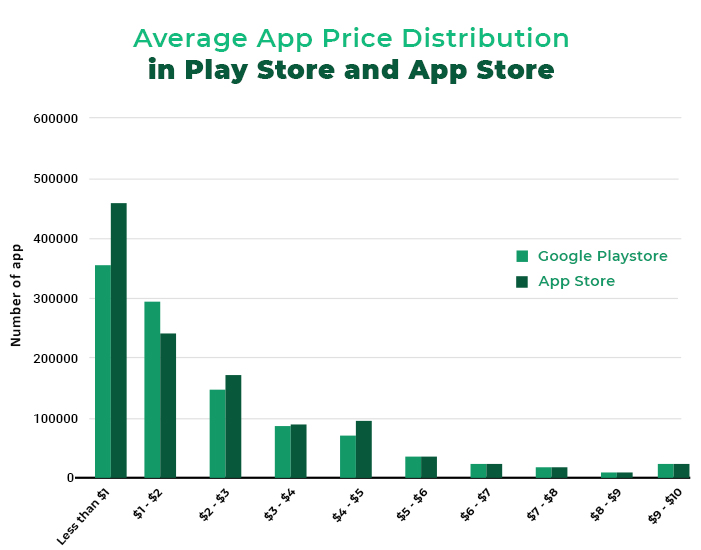
Besides all the app store data given above, we have something more for you. Here is a list of a few more app analytics that shows the combined data of App Store and Play Store.
Conclusion:
As new apps come to the market - The same way new numbers keep emerging every day. Though, the Google and iOS app store data we came up with will help you to add more valuables to your application.
The app industry is quite huge and creates immense app data every day. If you’re looking forward to making your mobile app a big name in this app industry, then always keep up with the numerals, especially around your app niche.
To know more about how to grow app popularity or list your app on some of the top platforms like Appshive, get in touch with our team.
Let’s raise a bar for your app!